Quality Dashboard & Weighted Health Score
Not all fields matter equally. A missing author list breaks co-authorship analysis; a missing language tag barely matters. The quality dashboard quantifies completeness with a bibliometrically weighted health score that reflects what downstream tools actually need.
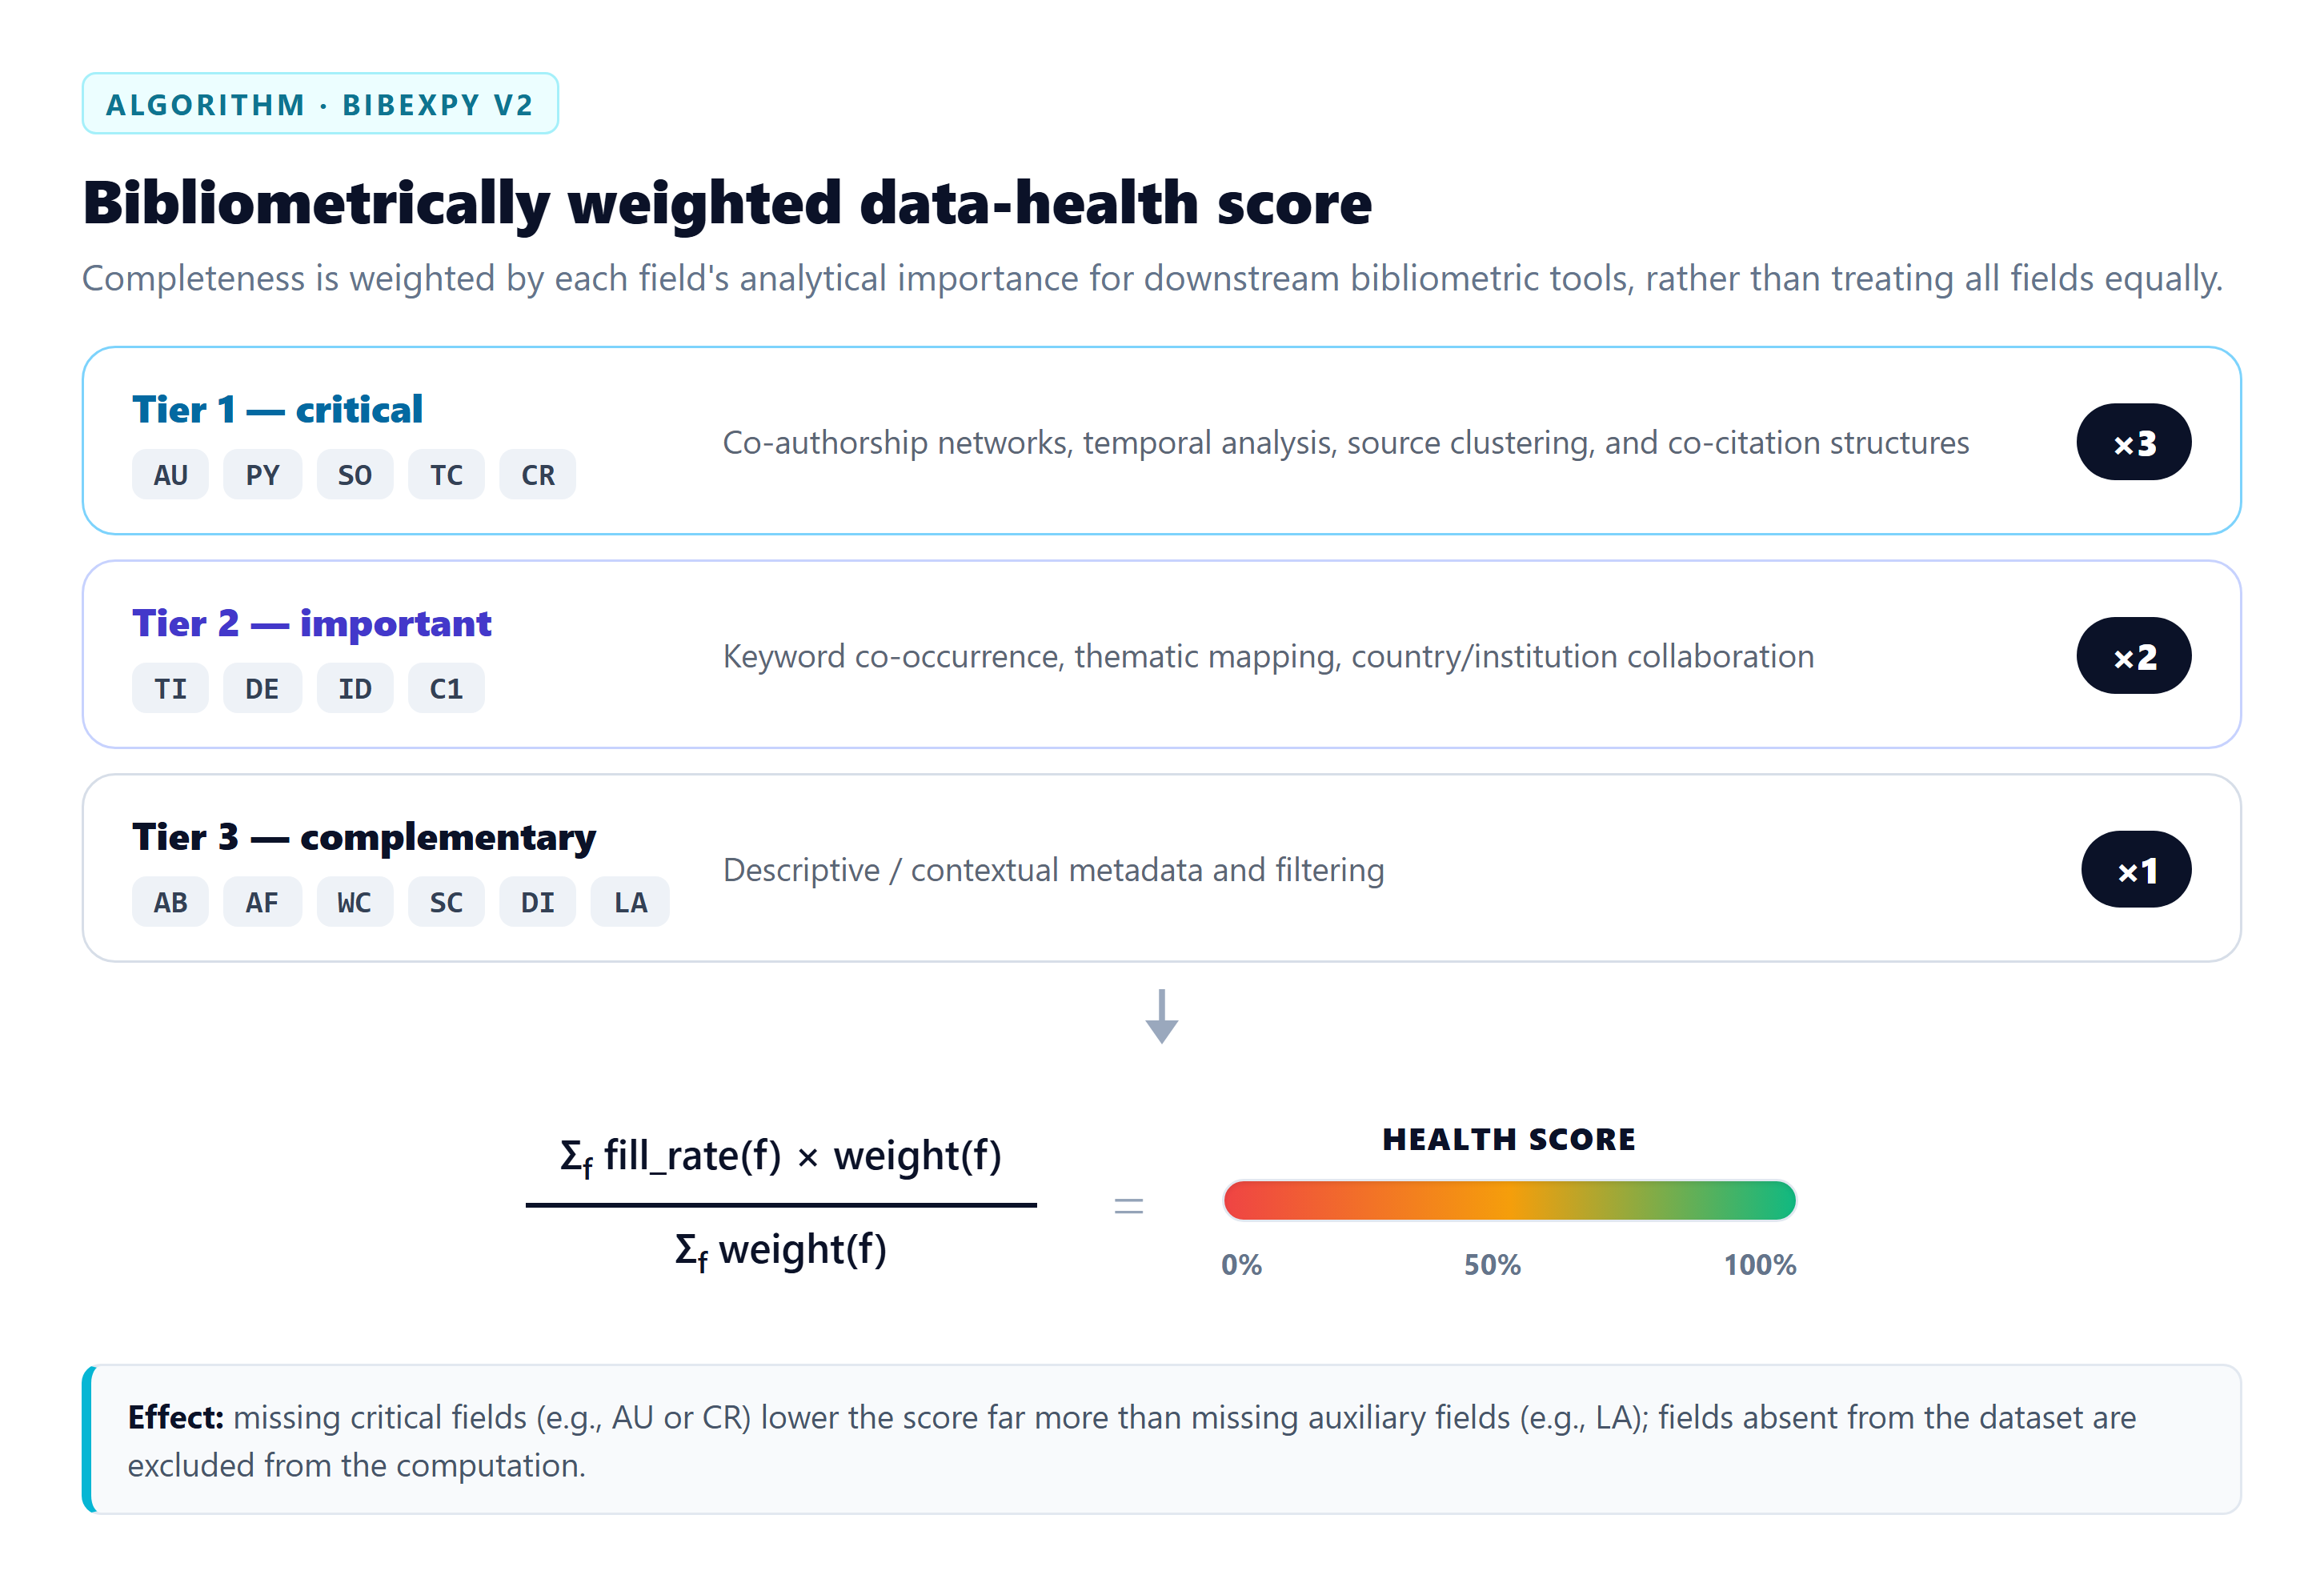
The tiers
| Tier | Weight | Fields | Why | | --- | --- | --- | --- | | 1 — Critical | ×3 | AU, PY, SO, TC, CR | Core of co-authorship, co-citation, source and citation analyses | | 2 — Important | ×2 | TI, DE, ID, C1 | Co-word maps, institution/country collaboration | | 3 — Useful | ×1 | AB, AF, WC, SC, DI, LA | Complementary, filtering and identity fields |
health = Σ (fill_rate(field) × weight(field)) / Σ weight(fields present)
Fields absent from the dataset are excluded from the computation rather than counted as zero — the score reflects your data, not the union of all possible tags.
The General Overview table
Alongside the score, the dashboard exposes a Biblioshiny-style General Overview table (timespan, sources, documents, annual growth, author counts, collaboration indices, …) — exportable as CSV, XLSX or a publication-ready PNG.
Reading the score
- Missing CR (cited references) hurts far more than missing LA — if you plan co-citation analysis, fix CR first (usually a WoS export-option issue).
- Re-run the dashboard after enrichment to verify the preparation actually moved the score.
Per-field breakdown
The dashboard lists every field's fill rate with color-coded bars, so you can see at a glance which enrichment source to enable next.